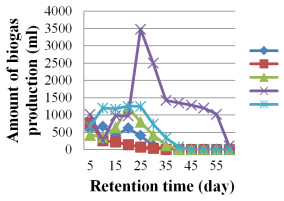
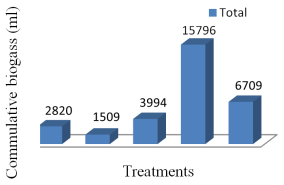
The global demand for energy grows rapidly, and therefore, it is a time to look alternative and renewable resources of energy to replace fossil fuels that harm the environment. On other hand, improper waste management creates environmental pollution and makes it unpleasant and unattractive for residences. Cow dung and poultry manures are the wastes produced from livestock and chicken, and they are important feedstock for biogas production. The main objectives of the present study was therefore, production of biogas from cow dung, poultry manure and their co-digestion, and evaluate the effect of biogas production parameter on the performance of anaerobic digestion process. In this study, batch mode of experimental digesters operated for 60 days at 37±0.5°C using five different ratios of cow dung to poultry manure mixtures as a feedstock. The feedstock were 100% of cow dung (T1), 100% of poultry manure (T2), 50% cow dung and 50% poultry manure mixture (T3), 75% poultry manure and 25% cow dung mixture (T4) and 75% cow dung and 25% poultry manure mixture (T5). The feedstock was characterized in terms of moisture contents (MC), total solids (TS), volatile solids (VS), pH, organic carbon (OC), total Kjeldahl nitrogen (TKN), carbon to nitrogen ratio (C: N) and ash contents (AC). Each digester was operated in triplicate and one way ANOVA was used to compare the characteristics of feedstock, amount and chemical composition of biogas produced from the different mixtures of feedstock. The volatile solid (VS) content was more than 58% in all feedstock and, which indicates that, the feed-stocks were biodegradable and suitable for biogas production. The Carbon to Nitrogen (C: N) ratio was in the range of 6.26±0.25 to 28.75±1.23. Lower C: N ratio (T2) indicates the biogas produced from this feedstock will be low and hence T2 is less preferred for biogas production. The pH value of all the feedstock were feasible for biogas production, except T1 (6.3), and significant difference was observed in all parameters among the feedstock. The total amount of biogas produced from T1, T2, T3, T4 and T5 was 2820ml, 1509ml, 3994ml, 15796ml and 6709ml, respectively. The highest biogas yield was recorded in T4. The quality of biogas in term of methane content was 56.3±0.91, 56.9±10, 57.8±0.95, 60.7±0.1 and 63.6±0.7 for T1, T2, T3, T4 and T5, respectively. In general, the present investigation revealed that, co-digestion encourages the feasibility of biogas from these feedstock. Even though, the methane concentration is higher in T5, T4 (75% poultry manure and 25% cow dung mixture) can be considered as the best feedstock for biogas production as it gives significantly high biogas yield as compared to the others. However, optimization of production parameters and analyzing other production factors need to be investigated in the future.
| Published in | American Journal of Environmental and Resource Economics (Volume 10, Issue 3) |
| DOI | 10.11648/j.ajere.20251003.11 |
| Page(s) | 82-96 |
| Creative Commons |
This is an Open Access article, distributed under the terms of the Creative Commons Attribution 4.0 International License (http://creativecommons.org/licenses/by/4.0/), which permits unrestricted use, distribution and reproduction in any medium or format, provided the original work is properly cited. |
| Copyright |
Copyright © The Author(s), 2025. Published by Science Publishing Group |
Biogas, Co-digestion, Cow Dung, Feedstock, Poultry Manure, Treatment
Treatments (T) | Feedstock proportion | |
|---|---|---|
Cow dung (%) | Poultry manure (%) | |
T1 | 100 | 0 |
T2 | 0 | 100 |
T3 | 50 | 50 |
T4 | 25 | 75 |
T5 | 75 | 25 |
Parameters | Treatments | ||||
|---|---|---|---|---|---|
T1 | T2 | T3 | T4 | T5 | |
%MC (db) | 22.00±1.00 | 20.00±1.00 | 19.00±1.00 | 16.00±0.00 | 13.00±1.00 |
%TS (g/VS) | 17.43±0.30 | 16.83±0.11 | 16.03±0.05 | 16.23±0.11 | 15.60±0.02 |
VS (as %TS) | 80.45±0.62 | 58.33±1.67 | 68.80±0.69 | 75.30±0.01 | 67.94±0.04 |
pH | 6.30±0.10 | 7.50±0.10 | 6.60±0.01 | 6.90±0.08 | 6.50±0.15 |
%OC | 46.77±0.32 | 33.91±0.04 | 39.97±0.01 | 43.77±0.34 | 39.53±0.05 |
TKN (g/l) | 1.80±0.05 | 5.41±0.21 | 1.85±0.10 | 1.52±0.05 | 1.61±0.03 |
C: N | 25.99±0.82 | 6.26±0.25 | 21.64±1.22 | 28.75±1.23 | 24.50±0.34 |
%AC | 22.98±0.61 | 45.23±0.54 | 36.25±0.85 | 28.39±1.11 | 33.33±0.42 |
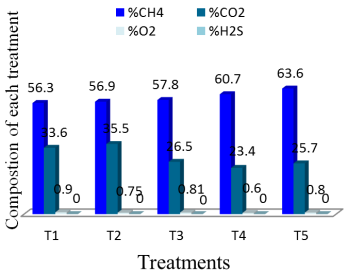
Treatments | Composition of gas for each treatment (%) | |||
|---|---|---|---|---|
CH4 | CO2 | O2 | H2S | |
T1 | 56.3D±0.91 | 33.6A±1.25 | 0.9A±0.06 | 0A±0 |
T2 | 56.9CD±1.0 | 35.5A±0.85 | 0.75A±0.21 | 0A±0 |
T3 | 57.8C±0.95 | 26.5B±2.52 | 0.81A±0.08 | 0A±0 |
T4 | 60.7B±0.10 | 23.4C±1.05 | 0.6B±0.14 | 0A±0 |
T5 | 63.6A±0.70 | 25.7BC±1.95 | 0.8A±0.01 | 0A±0 |
LSD (t) value | 1.46 | 2.99 | 0.22 | 0 |
Pr.>F | 0.024 | 0.0004 | 0.117 | ND |
ANOVA Decision | Significant | Significant | Non-significant | - |
CV | 1.36 | 5.69 | 15.91 | 0 |
Parameters | Source of Variation | DF | SS | MS | F-Value | Pr.>F | CV | ANOVA decision |
|---|---|---|---|---|---|---|---|---|
MC | Treatment | 4 | 150 | 37.5 | 46.88 | 0.0016 | Significant | |
Error | 10 | 8 | 0.8 | |||||
Total | 14 | 158 | ||||||
VS | Treatment | 4 | 837.35 | 209.33 | 286.38 | < 0.0001 | 1.21 | Significant |
Error | 10 | 7.30 | 0.73 | |||||
Total | 14 | 844.66 | ||||||
TS | Treatment | 4 | 6.16 | 1.54 | 62.26 | 0.0002 | 0.95 | Significant |
Error | 10 | 0.24 | 0.024 | |||||
Total | 14 | 6.41 | ||||||
PH | Treatment | 4 | 2.56 | 0.64 | 64.38 | 0.001 | 1.47 | Significant |
Error | 10 | 0.099 | 0.009 | |||||
Total | 14 | 2.66 | ||||||
OC | Treatment | 4 | 282.72 | 70.68 | 1557.3 | < 0.0001 | 0.52 | Significant |
Error | 10 | 0.45 | 0.045 | |||||
Total | 14 | 283.17 | ||||||
TKN | Treatment | 4 | 33.42 | 8.35 | 679.38 | < 0.0001 | 4.52 | Significant |
Error | 10 | 0.123 | 0.123 | |||||
Total | 14 | 33.54 | ||||||
C: N | Treatment | 4 | 942.28 | 235.57 | 301.65 | < 0.0001 | 4.12 | Significant |
Error | 10 | 7.809 | 0.78 | |||||
Total | 14 | 950.08 | ||||||
AC | Treatment | 4 | 844.85 | 211.21 | 375.99 | <0.0001 | 2.25 | Significant |
Error | 10 | 5.617 | 0.56 | |||||
Total | 14 | 850.47 |
Parameter | Treatments | LSD (t) value | ||||
|---|---|---|---|---|---|---|
T1 | T2 | T3 | T4 | T5 | ||
VS | 80.45A±0.62 | 58.33D±1.67 | 68.80C±0.69 | 75.03B±0.06 | 67.94C±0.04 | 1.55 |
MC | 13.00D±1.00 | 16.00C±0.00 | 20.00B±1.00 | 19.00B±1.00 | 22.00A±1.00 | 1.63 |
TS | 17.43A±0.30 | 16.83B±0.11 | 16.03C±0.01 | 16.23C±0.11 | 15.60D±0.02 | 0.29 |
PH | 6.30D±0.10 | 7.50A±0.10 | 6.60C±0.01 | 6.90B±0.08 | 6.50C±0.15 | 0.18 |
OC | 46.77A±0.32 | 33.91E±0.04 | 39.97C±0.01 | 43.77B±0.34 | 39.53D±0.05 | 0.39 |
TKN | 1.80BC±0.05 | 5.41A±0.21 | 1.85B±0.10 | 1.52D±0.05 | 1.61C±0.03 | 0.20 |
C: N | 25.99B±0.82 | 6.26D±0.25 | 21.64C±1.22 | 28.76A±1.23 | 24.50B±0.34 | 1.61 |
AC | 22.98E±0.61 | 45.23A±0.54 | 36.25B±0.85 | 28.39D±1.11 | 33.33C±0.42 | 1.36 |
Treatments | Cumulative biogas (ml) | LSD (t) value | Pr. > F | CV Value | ANOVA decision |
|---|---|---|---|---|---|
T1 | 2,820D ±285.11 | 324.65 | <0.0001 | 2.89 | Significant |
T2 | 1,509E ±162.31 | ||||
T3 | 3,994C ±121.11 | ||||
T4 | 15,796A ±162.31 | ||||
T5 | 6,709B ±94.59 |
AC | Ash Content |
AD | Anaerobic Digestion |
ANOVA | Analysis of Variance |
C: N | Carbon to Nitrogen Ratio |
CD | Cow Dung |
CH4 | Methane |
CO2 | Carbon Dioxide |
CRD | Completely Randomized Design |
H2 | Hydrogen |
H2O2 | Hydrogen Peroxide |
H2S | Hydrogen Sulfide |
H2SO4 | Sulfuric Acid |
HCl | Hydrochloric Acid |
HRT | Hydraulic Retention Time |
KOH | Potassium Hydroxide |
LSD | Least Significant Difference |
MC | Moisture Content |
N2 | Nitrogen |
NaCl | Sodium Chloride |
NaOH | Sodium Hydroxide |
O2 | Oxygen |
OC | Organic Carbon |
OLR | Organic Loading Rate |
pH | Power of Hydrogen |
PM | Poultry Manure |
R | Reactors |
SD | Standard Deviation |
T | Treatment |
TKN | Total Kjeldahl Nitrogen |
TS | Total Solids |
VS | Volatile Solids |
| [1] | Adelekan and Bamgboye, 2009. Effect of mixing ratio of slurry on biogas productivity of major farm animal waste types. Journal of Applied Biosciences (22): 1333- 1343. |
| [2] | Adeniran, A. K., Ahaneku, I. E., Itodo, I. N. and Rohjy H. A. 2014. Relative effectiveness of biogas production using poultry wastes and cow dung. Agric Eng Int: CIGR Journal. 16(1): 126-132. |
| [3] | Amare, Z. 2014. The role of Biogas Energy Production and Use in Greenhouse Gas Emission Reduction; the case of Amhara National Regional State, Fogera District, Ethiopia. Journal of Multidisciplinary Engineering Science and Technology 1(5): 404-410. |
| [4] | American Public Health Association (APHA). 1999. Standard Methods for the Examination of Water and Waste water. 20th edition. |
| [5] | Angelidaki, I. and Ellegaard, L. 2003. Co-Digestion of Manure and Organic Wastes in Centralized Biogas Plant: Status and Future Trend; Environment and Resources, Technical University of Denmark: Lyngby, Denmark. |
| [6] | Aremu, MO. and Agarry, S. E. 2015. “Enhanced Biogas Production From Poultry Droppings Using Corn Cob and Waste Paper as Co-Substrate”, International Journal of Engineering Science and Technology (IJEST), ISSN: 0975-5462, Vol. 5 No. 02. |
| [7] | Atandi and Rahman. 2012. Prospect of anaerobic co-digestion of dairy manure: a review. Environ. Technol. Rev. 1, 127-135. |
| [8] | Badger, C. M., Bogue, M. J. and Stewart, D. J. 2009. ‘’Biogas production from crops and organic wastes.’’ Journal of Science, vol. 22, pp. 11-20. |
| [9] | Bayr, S., Ojanperä, M., Kaparaju, P., and Rintala, J. 2014. Long-term thermophilic mono-digestion of rendering wastes and co-digestion with potato pulp. Waste management, 34(10), 1853-1859. |
| [10] | Bouallagui, H., Lahdheb, H., Romdan, E. B., Rachdi, B., and Hamdi, M. 2009. Improvement of fruit and vegetable waste anaerobic digestion performance and stability with co-substrates addition. Journal of environmental management, 90(5), 1844-1849. |
| [11] | Bujoczek, G., Oleszkiewicz, J., Sparling, R., Cenkowski, S. 2000. High solid anaerobic digestion of chicken manure. J. Agric. Eng. Res. 76, 51-60. |
| [12] | Central Statistic Authority (CSA). 2017. Agriculture sample survey 2016/2017 (2009 E. C). Volume II, report on livestock and livestock characteristics (private peasant holdings), Addis Ababa. |
| [13] | Chen, Y., Cheng, J. J. and Creamer, K. S. 2008. Inhibition of anaerobic digestion process: a review. Bioresour. Technol. 99, 4044-4064. |
| [14] | Chukwuma, E. C., Umeghalu IC., Orakwe LC., Bassey EE. and Chukwuma JN. 2013. Determination of optimum mixing ratio of cow dung and poultry droppings in biogas production under tropical condition. 8(18): 1940-1948. |
| [15] | Chynoweth, DO. 2001. Renewable methane from anaerobic digestion of biomass. Renewable Energy 22: 1-8. |
| [16] | Dalle woreda water, energy and mining report., 2017. |
| [17] | Dawit, D. 2008. Estimating household energy demand of rural Ethiopia using an almost ideal demand system (AIDS), MSc Thesis, AAU, Ethiopia. |
| [18] | Dobers, G. M. (2019). Acceptance of biogas plants taking into account space and place. Energy Policy, 135, 110987. |
| [19] | Dou, Z., & Toth, J. D. (2021). Global primary data on consumer food waste: Rate and characteristics-A review. Resources, Conservation and Recycling, 168, 105332. |
| [20] | Elijah, TI. 2009. The Study of Cow Dung as Co-Substrate with Rice Husk in Biogas Production Sci Res Essays 4: 861-866. |
| [21] | EREDPC (Ethiopian Rural Energy Development and Promotion Centre) and SNV (Netherlands Development Organization). 2008. National Biogas Programme Ethiopia: Programme Implementation Document. EREDPC and SNV, Addis Ababa, Ethiopia. |
| [22] | Erraji, H., Asehraou, A., Tallou, A., & Rokni, Y. (2023). Assessment of biogas production and fertilizer properties of digestate from cow dung using household biogas digester. Biomass Conversion and Biorefinery, 1-7. |
| [23] | Ezekoye, VA. And Okeke, CE. 2006. Design, construction and performance evaluation of plastic bio-digester and the storage of biogas. The Pacific J Sci Technol 7: 176-184. |
| [24] | Fabien, M. 2003. An Introduction Anaerobic Digestion of Organic Wastes- Final Report Remade, Scotland. |
| [25] | Fernandes, F. Perin, J. K. H., Borth, P. L. B., Torrecilhas, A. R., da Cunha, L. S., & Kuroda, E. (2020). Optimization of methane production parameters during anaerobic codigestion of food waste and garden waste. Journal of cleaner production, 272, 123130. |
| [26] | Florian, G., Beatrice G., and Uli, Z. 2013. Sustainable biogas production. A handbook for organic farmers, Sustain Gas project. Frankfurt am Main, Germany. |
| [27] | Gangagni Rao, A., Sasi Kanth Reddy, T., Surya Prakash, S., Vanajakshi, J., Joseph, J., Jetty, A., Rajashekhara Reddy, A. and Sarma, PN. 2008. Biomethanation of poultry litter leachate in UASB reactor coupled with ammonia stripper for enhancement of overall performance. Bioresour. Technol. 99, 8679-8684. |
| [28] |
Hilkiahigoni, A., Ayotamuno, M., Eze, C., Ogaji, S. and Probert S. 2008. Designs of anaerobic digesters for producing biogas from municipal solid-waste. Applied Energy. 85(6): 430-438. Available at:
http://linkinghub.elsevier.com/retrieve/pii/S030626190700133X |
| [29] | Jagadish, H., Patil., Mal ourdu Antony Raj., Gavimath, Vinay, R. and Hooli. 2011. “A Commparative Study on Anaerobic Co-Digestion of Water Hyacinth With Poultry Litter and Cow Dung” International Journal of Chemical Sciences and Applications ISSN 0976-2590, Vol-2, Issue 2, pp 148-155. |
| [30] | John, RG., Douglas, G., Lisa. MT. and Gregory ES. 2000. Comparability of Suspended-Sediment Concentration and Total Suspended Solids Data; Water-Resources Investigations Report 00-419; U.S. Geological Survey, Reston, Virginia. |
| [31] | Jokela, J. P. Y. and Rintala, J. A. 2003. Anaerobic solubilisation of nitrogen from municipal solid waste (MSW). Rev. Environ. Sci. Biotechnol. |
| [32] | Karthikeyan, O. P. and Visvanathan, C. 2013. Bio-energy recovery from high-solid organic substrates by dry anaerobic bio-conversion processes: a review. Rev. Environ. Sci. Biotechnol. 12, 257-284. |
| [33] | Kashyap, D. R., Dadhich, K. S. and Sharma, S. K. 2003. Biomethanation under psychrophilic conditions: a review. Bioresour. Technol. 87(2003), 147-153. |
| [34] | Kenasa, G. and Kena, E. 2019. Optimization of Biogas Production from Avocado Fruit Peel Wastes Co-digestion with Animal Manure Collected from Juice Vending House in Gimbi Town, Ethiopia. Ferment Technol 8: 153. |
| [35] | Kougias P G, Fotidis I A, Zaganas I D, Kotsopoulos T A, Martzopoulos G G. Zeolite and swine inoculum effect on poultry manure biomethanation. International Agrophysics, 2017, 27(2): 169-173. |
| [36] | Lars, R. 2012. Biogas production in Belarus and Sweden. Exchange of experiences Project Report, The Baltic University Programme. |
| [37] | Li, K., Liu, R. and Chen, S. 2015. Comparison of anaerobic digestion characteristics and kinetics of four livestock manures with different substrate concentrations. Bioresour. Technol. 198, 133-140. |
| [38] | Lindkvist, E. (2020). System studies of biogas production: comparisons and performance (Vol. 2078). Linköping University Electronic Press. |
| [39] | M. K. Jameel, M. A. Mustafa, H. S. Ahmed, A. j. Mohammed, H. Ghazy, M. N. Shakir, A. M. Lawas, S. k. Mohammed, A. H. Idan, Z. H. Mahmoud, H. Sayadi, E. Kianfar, Biogas: Production, properties, applications, economic and challenges: A review, Results in Chemistry (2024), |
| [40] | Mahmoud, N. 2007. Anaerobic pre-treatment of sewage under low temperature (15°C) conditions in an integrated UASB-Digester system, Department of Environmental Technology, Wageningen University. |
| [41] | Mohammad Roman Miah, Abul Kalam, Lutfor Rahman, Muhammad Rajibul Akanda, Abdullah Pulak and Abdur Rouf. 2016. Production of biogas from poultry litter mixed with the co-substrate cow dung, Journal of Taibah University for Science, 10: 4, 497-504, |
| [42] | Montañés, R., Pérez, M. and Solera, R. 2014. Anaerobic mesophilic co-digestion of sewage sludge and sugar beet pulp lixiviation in batch reactors: effect of pH control. Chem Eng J 255: 492-499. |
| [43] | Monteiro, E., Mantha, V. and Rouboa, A. 2011. Prospective application of farm cattle manure for bioenergy production in Portugal. Renew. Energy, 36, 627-631. |
| [44] | National Biogas Programme Ethiopia (NBPE). 2008. Programme Implementation Document- Draft version. Ethiopia Rural Energy Development and Promotion Centre (EREDPC). |
| [45] | Price, C. A. H., Arnold, W., Pastor-Perez, L., Amini-Horri, B., & Reina, T. R. (2020). Catalytic upgrading of a biogas model mixture via low temperature DRM using multicomponent catalysts. Topics in Catalysis, 63, 281-293. |
| [46] | Rahman, M. H. and Muyeed A. 2010. Solid and Hazardous Waste Management, 1st ed., ITN-BUET, Dhaka, Bangladesh. |
| [47] | Rahmat, B., Hartoyo, T., and Sunarya, Y. 2014. Biogas production from tofu liquid waste on treated agricultural wastes. American Journal of Agricultural and Biological Sciences, 9(2), 226-231. |
| [48] | Rajeshwari, KV., Balakrishnan, M., Kansal, A., Lata, K. and Kishore, VN. 2009. State of the art of anaerobic digestion technology for industrial waste water treatment. Renewable and Sustainable Energy Rev 4: 135-156. |
| [49] | Rico, J. L., Garcia, H., Rico, C. and Tejero, I. 2007. Characterisation of solid and liquid fractions of dairy manure with regard to their component distribution and methane production. Bioresour. Technol. 98, 971-979. |
| [50] | Rohjy, Habeeb Ajibola, Aduba, Joseph Junior, Manta, Ibrahim Haruna & Pamdaya, Yohanna. 2013. “Development of Anaerobic Digester for the Production of Biogas using Poultry and Cattle Dung’’ A Case Study of Federal University of Technology Minna Cattle & Poultry Pen”, International Journal of Life Sciences, Vol. 2 No. 3 ISSN: 2277-193X. |
| [51] | Rouf, M. A., Bajpai, P. K. and Jotshi, C. K. 2009. Characterization of pressmud from sugar industry and its potential for biogas genera-tion, in: Proc. CHEMCON-99 (Indian Chemical Engineering Congress), Chandigarh, December 20-23. |
| [52] | Sebola, R., Tesfagiorgis, H. and Muzenda, E. 2014. Productionof Biogas through Anaerobic Digestion of various Wastes: Review. Intl' Conf. on Chemical, Integrated Waste Management & Environmental Engineering (ICCIWEE'2014) April 15-16, 2014 Johannesburg. |
| [53] | Shanique Grant, Alicia Marshalleck., 2014. “Energy Production and Pollution Mitigation from Broilers Houses on Poultry Farms in Jamaica and Pennsylvania”, International Journal for Service Learning in Engineering Vol. 3, No. 1, pp. 41- 52, ISSN 1555-9033. |
| [54] | Singh, A. (2019). Managing the uncertainty problems of municipal solid waste disposal. Journal of environmental management, 240, 259-265. |
| [55] | Steffen, R., Szolar, O. and Braun, R. 2000. Feedstock for anaerobic digestion. AD-Nett report 2000. Anaerobic digestion: making. energy and solving modern waste problem. |
| [56] | Tengku, R., Tuan, Y., Hasfalina, C. M., Nor’ Aini A. R. and Halimatun S. H. 2014. Optimization of Methane Gas Production From Co-Digestion of Food Waste and Poultry Manure Using Artificial Neural Network and Response Surface Methodology. Journal of Agricultural Science, 6(7): 27-37. |
| [57] | Thangamani, A., Rajakumar, S. and Ramanujam, R. A. 2010. Anaerobic co-digestion of hazardous tannery solid waste and primary sludge: biodegradation kinetics and metabolite analysis, Clean Technol. Environ. Policy 12, 517-524. |
| [58] | Triolo, J. L., Ward, A. J., Pedersen, L. and Sommer, S. G. 2013. Characteristics of Animal Slurry as a Key Biomass for Biogas Production in Denmark. In Biomass Now-Sustainable Growth and Use; Matovic, M. D., Ed.; InTech-Open Access Publisher: London, UK. |
| [59] | Tsapekos P, Kougias P G, Treu L, Campanaro S, Angelidaki I. Process performance and comparative metagenomic analysis during co-digestion of manure and lignocellulosic biomass for biogas production. Applied Energy, 2017, 185(1): 126-135. |
| [60] | Wang, X., Yang, G., Feng, Y., Ren, G. and Han, X. 2012. Optimizing feeding composition and carbon-nitrogen ratios for improved methane yield during anaerobic co-digestion of dairy, chicken manure and wheat straw. Bioresour. Technol. 120, 78-83. |
| [61] | Webler, T. and Tuler, S. P. 2010. Getting the engineering right is not always enough: Researching the human dimensions of the new energy technologies. Energy Policy, 38(6), pp. 2690-2691. |
| [62] | Yaldiz, O., Sozer, S., Caglayan, N., Ertekin, C. and Kaya, D. 2011. Methane Production from Plant Wastes and Chicken Manure at Different Working Conditions of a One-stage Anaerobic Digester. Energy Sources Part a- Recovery 33: 1802-1813. |
| [63] | Zhang, C., Su, H., Baeyens, J. and Tan, T. 2014. Reviewing the anaerobic digestion of food waste for biogas production. Renew. Sustain. Energy Rev. 38, 383-392. |
| [64] | Zhang, He, Y., Xie, Z., H., Liebl, W., Toyama, H., & Chen, F. (2022). Oxidative fermentation of acetic acid bacteria and its products. Frontiers in Microbiology, 13, 879246. |
APA Style
Telo, D. K., Yigezu, Z. D. (2025). Production and Characterization of Biogas from Cow Dung, Poultry Manure and Their Co-digestion. American Journal of Environmental and Resource Economics, 10(3), 82-96. https://doi.org/10.11648/j.ajere.20251003.11
ACS Style
Telo, D. K.; Yigezu, Z. D. Production and Characterization of Biogas from Cow Dung, Poultry Manure and Their Co-digestion. Am. J. Environ. Resour. Econ. 2025, 10(3), 82-96. doi: 10.11648/j.ajere.20251003.11
@article{10.11648/j.ajere.20251003.11,
  author = {Daniel Kebede Telo and Zerihun Demrew Yigezu},
  title = {Production and Characterization of Biogas from Cow Dung, Poultry Manure and Their Co-digestion
},
  journal = {American Journal of Environmental and Resource Economics},
  volume = {10},
  number = {3},
  pages = {82-96},
  doi = {10.11648/j.ajere.20251003.11},
  url = {https://doi.org/10.11648/j.ajere.20251003.11},
  eprint = {https://article.sciencepublishinggroup.com/pdf/10.11648.j.ajere.20251003.11},
  abstract = {The global demand for energy grows rapidly, and therefore, it is a time to look alternative and renewable resources of energy to replace fossil fuels that harm the environment. On other hand, improper waste management creates environmental pollution and makes it unpleasant and unattractive for residences. Cow dung and poultry manures are the wastes produced from livestock and chicken, and they are important feedstock for biogas production. The main objectives of the present study was therefore, production of biogas from cow dung, poultry manure and their co-digestion, and evaluate the effect of biogas production parameter on the performance of anaerobic digestion process. In this study, batch mode of experimental digesters operated for 60 days at 37±0.5°C using five different ratios of cow dung to poultry manure mixtures as a feedstock. The feedstock were 100% of cow dung (T1), 100% of poultry manure (T2), 50% cow dung and 50% poultry manure mixture (T3), 75% poultry manure and 25% cow dung mixture (T4) and 75% cow dung and 25% poultry manure mixture (T5). The feedstock was characterized in terms of moisture contents (MC), total solids (TS), volatile solids (VS), pH, organic carbon (OC), total Kjeldahl nitrogen (TKN), carbon to nitrogen ratio (C: N) and ash contents (AC). Each digester was operated in triplicate and one way ANOVA was used to compare the characteristics of feedstock, amount and chemical composition of biogas produced from the different mixtures of feedstock. The volatile solid (VS) content was more than 58% in all feedstock and, which indicates that, the feed-stocks were biodegradable and suitable for biogas production. The Carbon to Nitrogen (C: N) ratio was in the range of 6.26±0.25 to 28.75±1.23. Lower C: N ratio (T2) indicates the biogas produced from this feedstock will be low and hence T2 is less preferred for biogas production. The pH value of all the feedstock were feasible for biogas production, except T1 (6.3), and significant difference was observed in all parameters among the feedstock. The total amount of biogas produced from T1, T2, T3, T4 and T5 was 2820ml, 1509ml, 3994ml, 15796ml and 6709ml, respectively. The highest biogas yield was recorded in T4. The quality of biogas in term of methane content was 56.3±0.91, 56.9±10, 57.8±0.95, 60.7±0.1 and 63.6±0.7 for T1, T2, T3, T4 and T5, respectively. In general, the present investigation revealed that, co-digestion encourages the feasibility of biogas from these feedstock. Even though, the methane concentration is higher in T5, T4 (75% poultry manure and 25% cow dung mixture) can be considered as the best feedstock for biogas production as it gives significantly high biogas yield as compared to the others. However, optimization of production parameters and analyzing other production factors need to be investigated in the future.},
 year = {2025}
}
TY  - JOUR
T1  - Production and Characterization of Biogas from Cow Dung, Poultry Manure and Their Co-digestion

AU  - Daniel Kebede Telo
AU  - Zerihun Demrew Yigezu
Y1  - 2025/08/26
PY  - 2025
N1  - https://doi.org/10.11648/j.ajere.20251003.11
DO  - 10.11648/j.ajere.20251003.11
T2  - American Journal of Environmental and Resource Economics
JF  - American Journal of Environmental and Resource Economics
JO  - American Journal of Environmental and Resource Economics
SP  - 82
EP  - 96
PB  - Science Publishing Group
SN  - 2578-787X
UR  - https://doi.org/10.11648/j.ajere.20251003.11
AB  - The global demand for energy grows rapidly, and therefore, it is a time to look alternative and renewable resources of energy to replace fossil fuels that harm the environment. On other hand, improper waste management creates environmental pollution and makes it unpleasant and unattractive for residences. Cow dung and poultry manures are the wastes produced from livestock and chicken, and they are important feedstock for biogas production. The main objectives of the present study was therefore, production of biogas from cow dung, poultry manure and their co-digestion, and evaluate the effect of biogas production parameter on the performance of anaerobic digestion process. In this study, batch mode of experimental digesters operated for 60 days at 37±0.5°C using five different ratios of cow dung to poultry manure mixtures as a feedstock. The feedstock were 100% of cow dung (T1), 100% of poultry manure (T2), 50% cow dung and 50% poultry manure mixture (T3), 75% poultry manure and 25% cow dung mixture (T4) and 75% cow dung and 25% poultry manure mixture (T5). The feedstock was characterized in terms of moisture contents (MC), total solids (TS), volatile solids (VS), pH, organic carbon (OC), total Kjeldahl nitrogen (TKN), carbon to nitrogen ratio (C: N) and ash contents (AC). Each digester was operated in triplicate and one way ANOVA was used to compare the characteristics of feedstock, amount and chemical composition of biogas produced from the different mixtures of feedstock. The volatile solid (VS) content was more than 58% in all feedstock and, which indicates that, the feed-stocks were biodegradable and suitable for biogas production. The Carbon to Nitrogen (C: N) ratio was in the range of 6.26±0.25 to 28.75±1.23. Lower C: N ratio (T2) indicates the biogas produced from this feedstock will be low and hence T2 is less preferred for biogas production. The pH value of all the feedstock were feasible for biogas production, except T1 (6.3), and significant difference was observed in all parameters among the feedstock. The total amount of biogas produced from T1, T2, T3, T4 and T5 was 2820ml, 1509ml, 3994ml, 15796ml and 6709ml, respectively. The highest biogas yield was recorded in T4. The quality of biogas in term of methane content was 56.3±0.91, 56.9±10, 57.8±0.95, 60.7±0.1 and 63.6±0.7 for T1, T2, T3, T4 and T5, respectively. In general, the present investigation revealed that, co-digestion encourages the feasibility of biogas from these feedstock. Even though, the methane concentration is higher in T5, T4 (75% poultry manure and 25% cow dung mixture) can be considered as the best feedstock for biogas production as it gives significantly high biogas yield as compared to the others. However, optimization of production parameters and analyzing other production factors need to be investigated in the future.
VL  - 10
IS  - 3
ER  -
Department of Bio-Energy Science and Technology, College of Agriculture, Hawassa University, Hawassa, Ethiopia
Department of Bio-Energy Science and Technology, College of Agriculture, Hawassa University, Hawassa, Ethiopia